
Mapping the hills of Meghalaya — cartography as exploration.
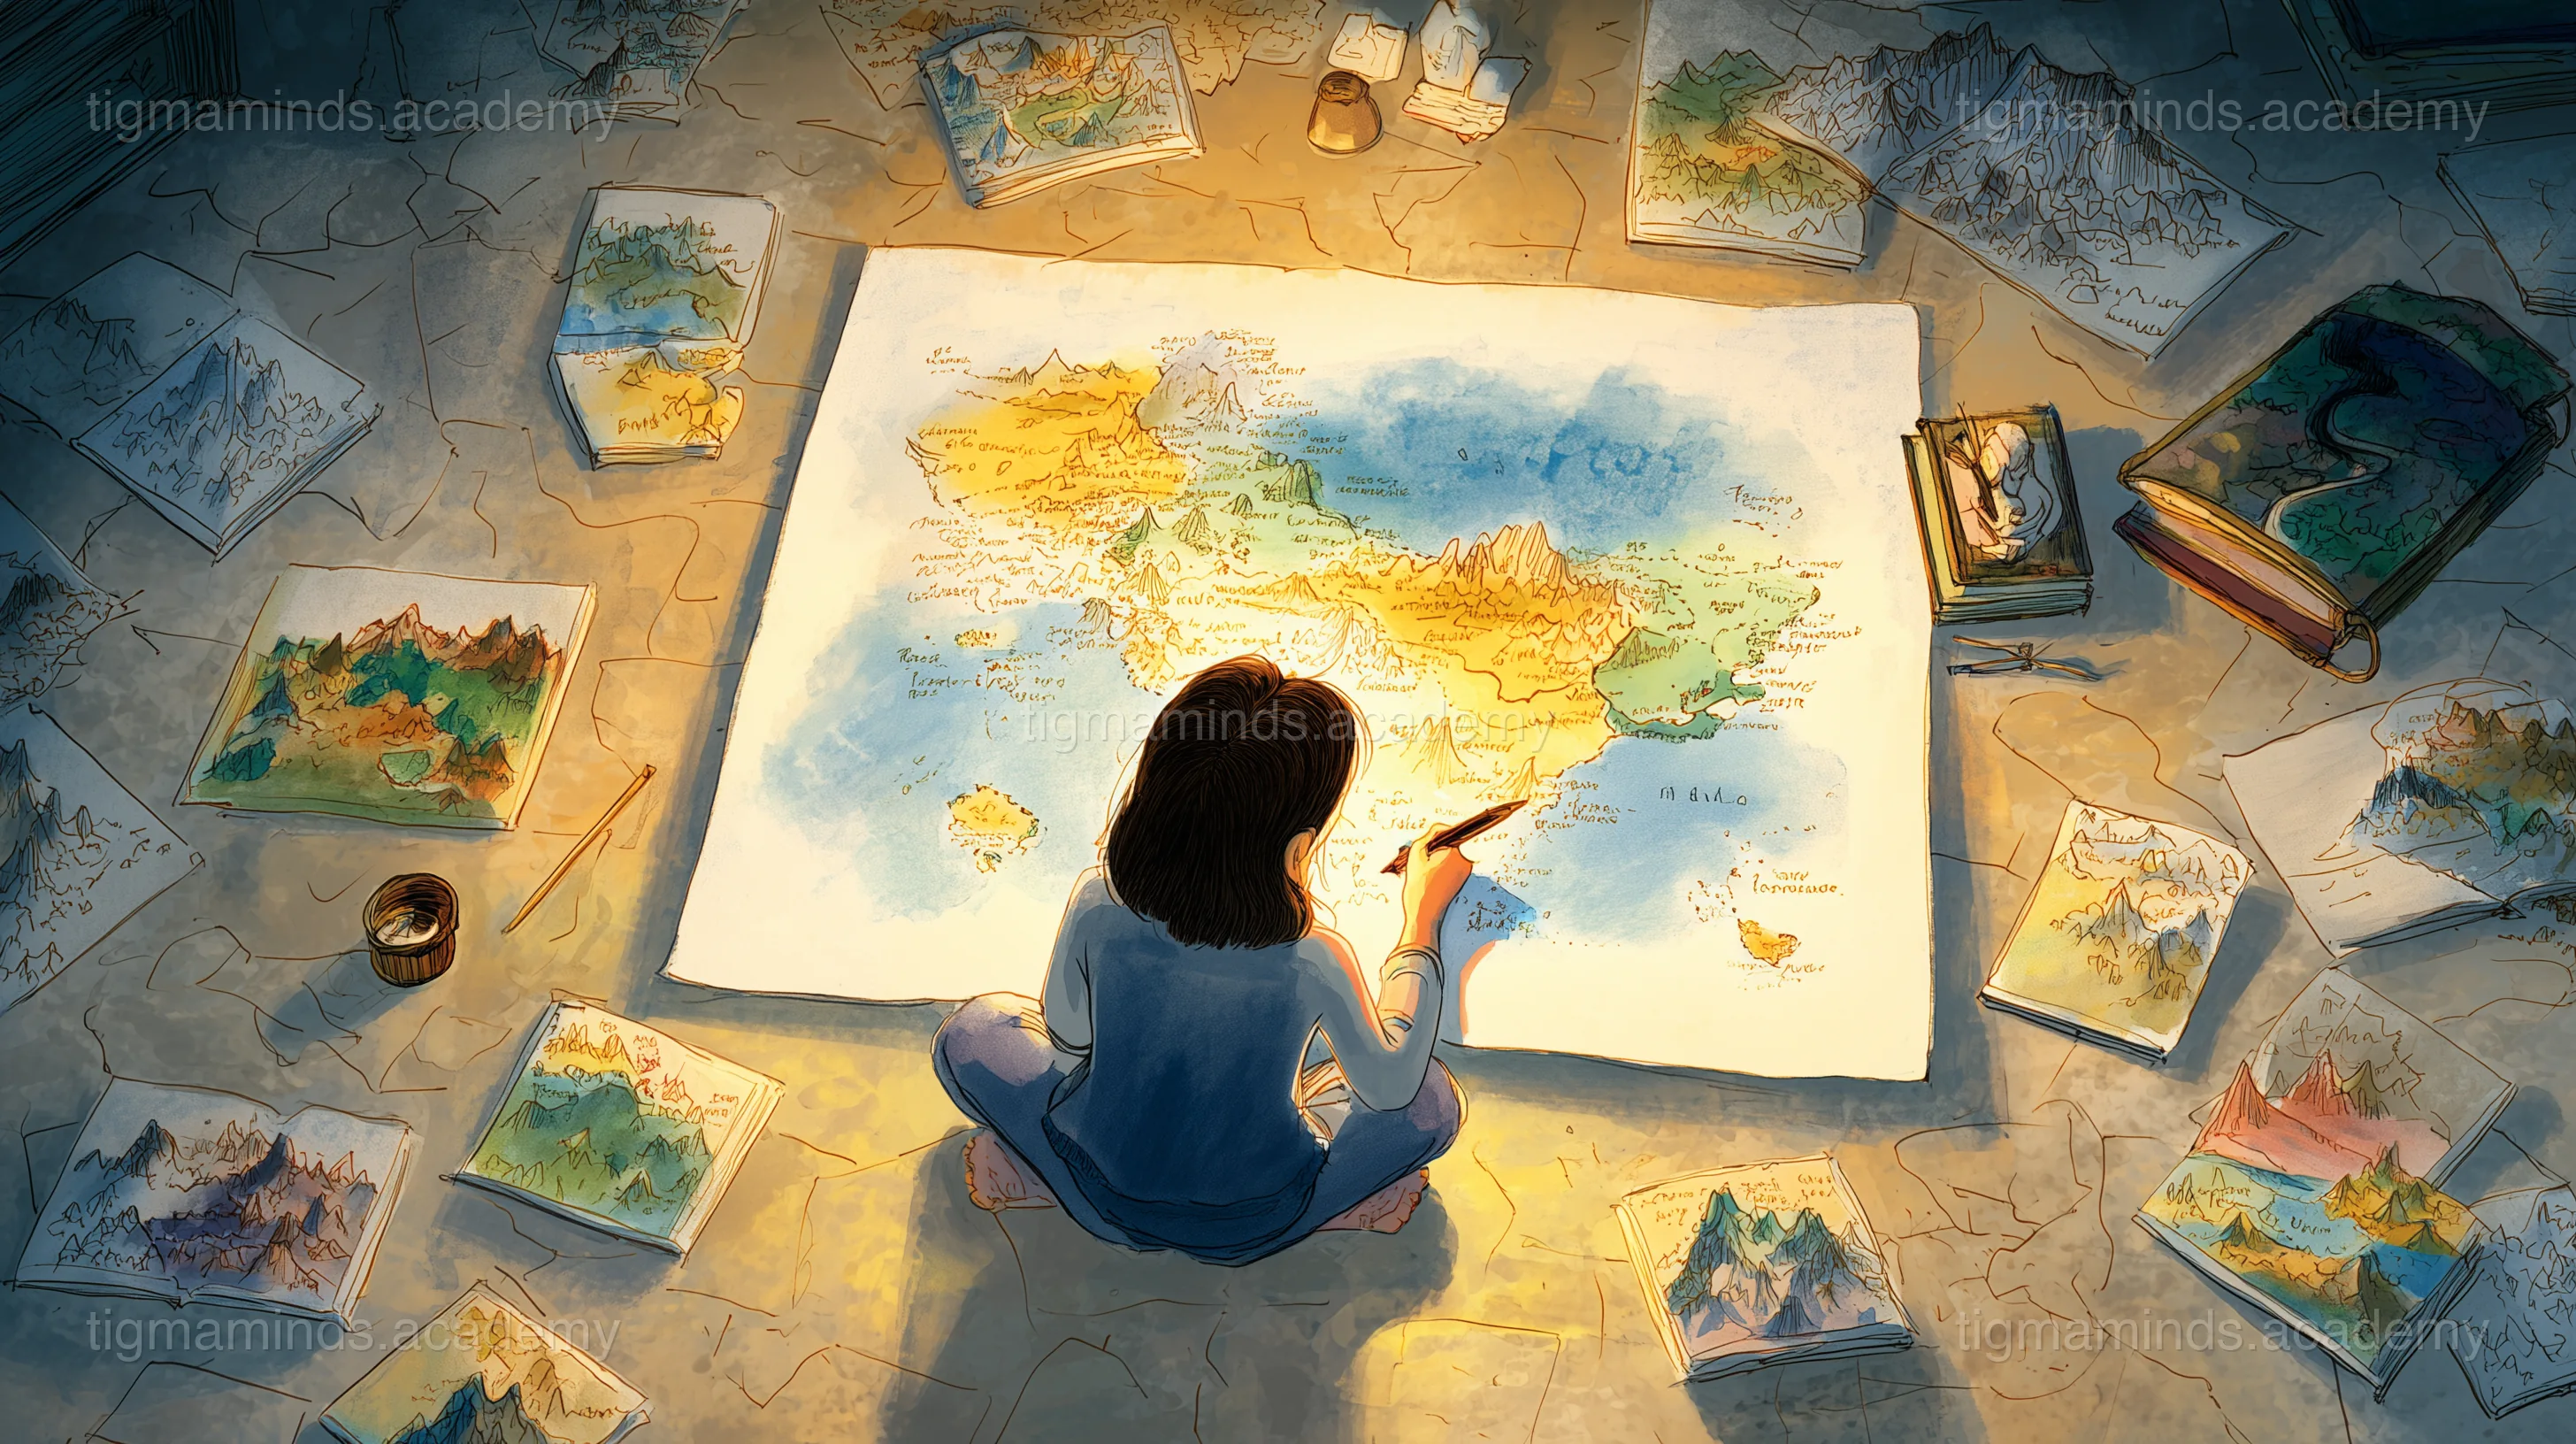
The Girl With Maps in Her Head
In a small house in Jorhat, Assam, there lived a girl named Anusha who could draw maps from memory. Not rough sketches with wobbly lines — real maps, with rivers in the right places, mountains at the correct heights, and towns marked with tiny careful dots.
She had learned this from her grandfather, Koka, who had been a surveyor for the government. For forty years, Koka had walked the hills and valleys of Northeast India with a compass and a notebook, measuring distances and drawing the land as it truly was.
"A map," Koka always said, "is not just lines on paper. A map is a story of the land. Every river has a beginning and an end. Every mountain has a reason for being where it is. If you understand the story, you can draw the map from memory."
Anusha understood. By the time she was ten, she could draw all eight states of Northeast India with her eyes closed.
The School Project
One day, Anusha's teacher announced a project: each student would make a map of their neighbourhood. Most students pulled out rulers and drew neat squares for houses and straight lines for roads.
Anusha did something different. She drew the old peepal tree where the neighbourhood aunties gathered every evening. She drew the puddle near the tea stall that never dried up, even in winter. She drew the shortcut through the bamboo grove that only the children knew about. She drew the spot where the street dog, Bholu, slept every afternoon.
"This isn't a proper map," said her classmate Ritu. "Where are the road names? Where's the scale?"
"This is a story map," said Anusha. "It shows what the neighbourhood feels like, not just what it looks like."
Koka's Maps
That evening, Anusha asked Koka to show her his old survey maps. He brought out a wooden trunk and opened it. Inside were hundreds of hand-drawn maps, each one folded carefully and labelled with a date and a place.
There was a map of the Brahmaputra from 1972, showing every sandbar and channel. There was a map of Kaziranga from 1980, with tiny rhino footprints drawn in the margins. There was a map of the Patkai Hills from 1965, with notes like "Beautiful orchids here" and "Met a kind family who gave me rice and dal."
"Koka," said Anusha, "these aren't just survey maps. These are your diary."
Koka smiled. "Every map I made told two stories. One was the story of the land — the official story, with measurements and coordinates. The other was my story — where I walked, what I saw, who I met. The best maps tell both."
The Map of Northeast India
Inspired by her grandfather, Anusha began a project that would take her three years. She decided to draw a single, enormous map of all of Northeast India — but not an ordinary map. Each state would be filled with the stories that made it special.
Assam was filled with tea gardens and river dolphins and one-horned rhinos. Meghalaya had living root bridges and rain clouds and pitcher plants. Nagaland had hornbills and warrior shields and the Hornbill Festival. Manipur had Loktak Lake and its floating islands. Mizoram had rolling green hills and bamboo forests. Tripura had ancient temples and rubber plantations. Arunachal Pradesh had snow peaks and monasteries and orchids. Sikkim had Kangchenjunga watching over everything like a grandmother.
When she finished, the map was two metres wide and covered an entire wall of her bedroom. It was the most beautiful map anyone in Jorhat had ever seen.
The Map Maker's Secret
Koka looked at the finished map for a long time. Then he took Anusha's hand and said, "You know the secret now."
"What secret?"
"That a map is not about geography. A map is about love. You can only draw a place truly if you love it — every river, every hill, every village. The lines follow your heart, not your ruler."
Anusha kept drawing maps. Maps of her school. Maps of her grandmother's kitchen. Maps of places she had never been but hoped to visit. Each one was a story, and each story was a map — because in the end, every journey we take leaves a line on the map of who we are.
The end.
Choose your level. Everyone starts with the story — the code gets deeper as you go.
Here is a taste of what Level 1 looks like for this lesson:
# Plot your school on a coordinate grid
latitude = 26.14 # Guwahati (degrees North)
longitude = 91.74 # Guwahati (degrees East)
# How far is Delhi?
delhi_lat, delhi_lon = 28.61, 77.21
# Each degree of latitude ≈ 111 km
dist_north = (delhi_lat - latitude) * 111 # km
dist_east = (delhi_lon - longitude) * 111 * 0.89 # adjusted for latitude
total = (dist_north**2 + dist_east**2)**0.5
print(f"Your location: {latitude}°N, {longitude}°E")
print(f"Delhi: {delhi_lat}°N, {delhi_lon}°E")
print(f"Straight-line distance: {total:.0f} km")This is just the first of 6 coding exercises in Level 1. By Level 4, you will build: Create a Digital Map of Your Neighborhood.
Free
Level 0: Listener
Stories, science concepts, diagrams, quizzes. No coding.
You are here
Level 0 is always free. Coding levels (1-4) are part of our 12-Month Curriculum.
Mapping the hills of Meghalaya — cartography as exploration.
The big idea: "The Map Maker's Granddaughter" teaches us about Cartography & GIS — and you don't need to write a single line of code to understand it.
If a friend asks "Where is your house?", you might say "Near the peepal tree, past the tea stall, turn left at the big puddle." That works — if your friend knows the peepal tree. But what if they are in Delhi? Or London? You need a system that works for anyone, anywhere.
The solution: imagine wrapping the Earth in a grid, like graph paper around a ball. Horizontal lines run east-west — these measure latitude (how far north or south of the equator you are, from 0° at the equator to 90° at the poles). Vertical lines run north-south — these measure longitude (how far east or west of a starting line through London, from 0° to 180°).
Every point on Earth gets a unique pair of numbers. Guwahati is at about 26.1°N, 91.7°E. This means: 26.1 degrees north of the equator, 91.7 degrees east of London. No other place on Earth has these exact numbers. With just two numbers, you can pinpoint any location on the planet.
Try this: Open any map app on a phone. Long-press on your school. It will show two numbers — those are your latitude and longitude. Now long-press on the Taj Mahal. Compare the numbers. Which changed more — latitude (north-south) or longitude (east-west)?
Key idea: Latitude (north-south from the equator) and longitude (east-west from London) form a grid that gives every point on Earth a unique pair of numbers — a universal address system.
Try this at home: take an orange and draw the outline of India on its skin with a marker. Now peel the orange and try to flatten the peel on a table. What happens? The peel tears, stretches, and distorts. India’s shape gets warped. This is the fundamental problem of cartography: Earth is round, and paper is flat. You cannot make the peel lie flat without stretching or tearing something.
Every flat map is a compromise. Map makers call these compromises projections. Different projections sacrifice different things:
For a map of your neighbourhood or your district, this problem barely matters — over a few hundred kilometres, Earth’s curve is tiny. But for a world map, the choice of projection changes what you believe about the world. Students who only see Mercator maps grow up thinking Europe is bigger than South America (it is not — South America is nearly twice the size).
Question to think about: Anusha in the story drew a map with the peepal tree and the puddle. Is her map a projection? (Answer: Yes — she projected the 3D world onto a flat page. For a small area, the distortion is negligible, but she still made choices about what to include and what to leave out.)
Key idea: Earth is round; maps are flat. Every flat map distorts something — shape, area, distance, or direction. Different projections make different trade-offs, and no map is perfectly accurate.
Access all 130+ lessons, quizzes, interactive tools, and offline activities
A paper map shows you one picture. But what if you could stack transparent sheets on top of each other — one showing rivers, one showing roads, one sh...