Data science starts with counting.
The Butterfly Notebook
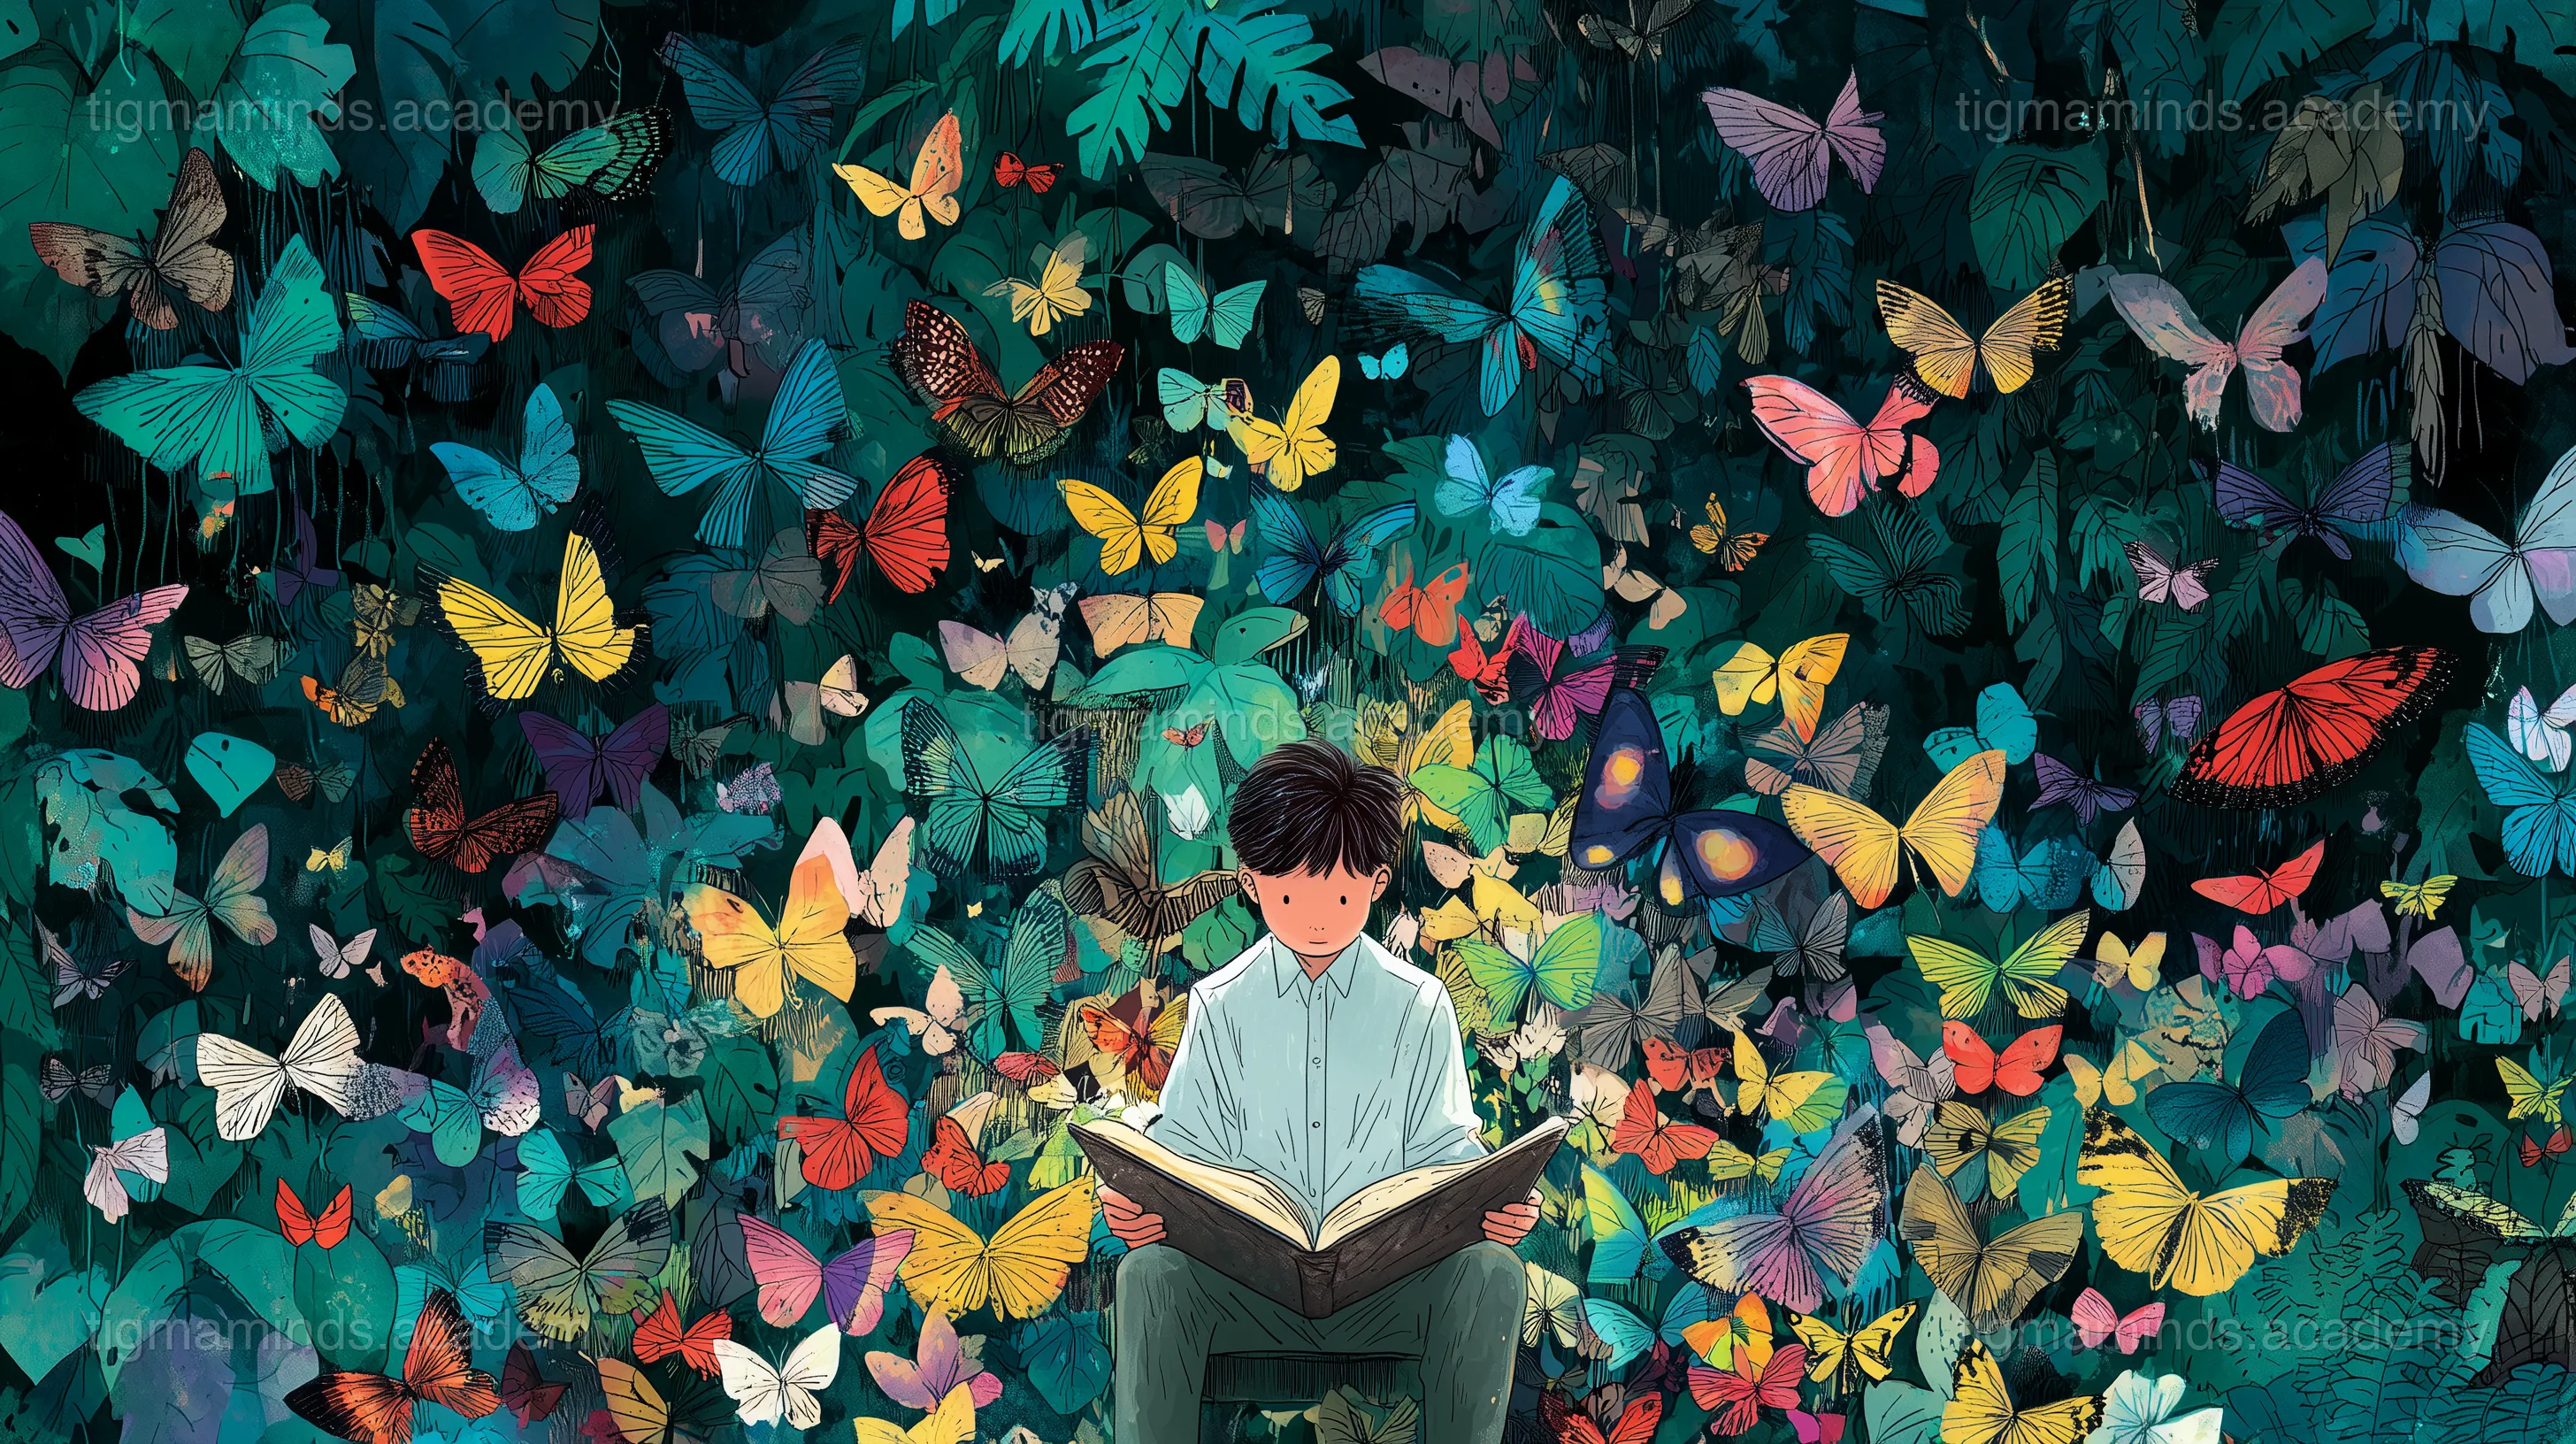
In a small village at the edge of Namdapha National Park in Arunachal Pradesh, a boy named Talo carried a notebook everywhere he went. It was not a school notebook — it was a butterfly notebook. Every page had a date, a place, and a drawing of a butterfly, coloured with the pencils his teacher had given him.
"Why do you count butterflies?" asked his sister, Yami, who thought bugs were boring.
"Because somebody should," said Talo.
That was the only reason he had, and it was enough.
The Forest of Wings
Namdapha is one of the wildest places in all of India. It stretches from the river valleys to the snow-capped peaks of the Patkai Range, and inside it live tigers, clouded leopards, red pandas, and more species of butterfly than almost anywhere on Earth.
Talo knew this because his father, a forest guard, had told him. "The scientists say there are over five hundred species of butterfly in Namdapha," his father said. "But no one has counted them all. The forest is too big, and the butterflies are too many."
Talo decided he would try.
Every morning before school, he walked the trail from his village to the river, noting every butterfly he saw. He drew the ones he didn't recognise — their wing patterns, their colours, the shape of their antennae. He gave them names until he could look them up: the blue flasher, the orange dot, the tiny white one that only comes out at noon.
The Pattern
After six months, Talo had filled three notebooks. He spread them on the floor of his house and looked at the numbers. Something strange jumped out.
In the part of the trail near the old-growth forest, where the trees were ancient and the canopy was thick, he had counted forty-two species. But near the part where loggers had cleared trees five years ago, he had counted only eleven.
"Baba," Talo said to his father, "why are there fewer butterflies where the trees were cut?"
His father sat down and looked at the notebooks carefully. "Because butterflies don't just need flowers," he said. "They need specific plants for their caterpillars. They need shade at certain times of day. They need moisture. They need the whole forest — not just a piece of it."
"So if the butterflies are gone," said Talo slowly, "it means the forest is sick?"
"Exactly," said his father. "Butterflies are like a thermometer for the forest. When you count butterflies, you are counting how healthy the whole ecosystem is."
The Scientist's Visit
That winter, a butterfly scientist from the Zoological Survey of India came to Namdapha. Talo's father introduced them. The scientist, Dr. Mitra, looked at Talo's notebooks and her eyes went wide.
"This boy has recorded species we haven't documented in this part of the park," she said. "And his data on population changes — this is exactly what we need. You've been doing real science, Talo."
Talo blushed. "I was just counting."
"Counting is science," said Dr. Mitra. "The most important science starts with someone paying attention."
The Butterfly Census
Dr. Mitra helped Talo organise the first Namdapha Butterfly Census — a day when children from villages across the park walked their trails, counted butterflies, and sent their numbers to a central tally. Thirty-seven children participated. Together, they counted two hundred and fourteen species in a single day.
The data showed what Talo's notebooks had already whispered: the forest was healthiest where it was oldest, and most fragile where it had been disturbed. The park authorities used the census to decide where to focus their conservation efforts.
Talo kept counting. He is still counting. His notebooks now fill an entire shelf, and every page is a tiny portrait of the forest's health, drawn in coloured pencil by a boy who believed that somebody should pay attention — and decided that somebody was him.
The end.
Choose your level. Everyone starts with the story — the code gets deeper as you go.
Here is a taste of what Level 1 looks like for this lesson:
# Mark-recapture: estimate butterfly population!
marked_first_visit = 40 # M: butterflies marked
caught_second_visit = 50 # C: total caught in round 2
recaptured_marked = 8 # R: marked ones recaptured
# Lincoln-Petersen formula: N = (M * C) / R
estimated_population = (marked_first_visit * caught_second_visit) / recaptured_marked
print(f"Estimated population: {estimated_population:.0f} butterflies")
# How confident are we? 95% confidence interval
import math
se = estimated_population * math.sqrt((1/recaptured_marked) - (1/caught_second_visit))
print(f"95% CI: {estimated_population - 1.96*se:.0f} to {estimated_population + 1.96*se:.0f}")This is just the first of 6 coding exercises in Level 1. By Level 4, you will build: Conduct a Butterfly Population Survey.
By Level 4, enrolled students build: Conduct a Butterfly Population Survey
Free
Level 0: Listener
Stories, science concepts, diagrams, quizzes. No coding.
You are here
Level 0 is always free. Coding levels (1-4) are part of our 12-Month Curriculum.
Data science starts with counting.
The big idea: "The Boy Who Counted Butterflies" teaches us about Data Collection & Citizen Science — and you don't need to write a single line of code to understand it.
How do you count a population of animals that move, hide, and look alike? You cannot simply count every individual — most wild populations are too large, too mobile, or too cryptic for a complete census. The mark-recapture method, developed by C.G.J. Petersen for fish populations in the 1890s, provides an elegant statistical solution. In the simplest version (the Lincoln-Petersen method), you capture a sample of animals, mark them (with paint, bands, tags, or wing dots for butterflies), release them, and then capture a second sample later.
The mathematics is beautifully simple. If you mark M animals in the first sample, and later capture a second sample of C animals, of which R are recaptured (already marked), then the estimated total population N = (M × C) / R. The logic is that the proportion of marked animals in the second sample should equal the proportion of marked animals in the total population: R/C = M/N. If you marked 100 butterflies and later caught 50, of which 10 were marked, then N = (100 × 50) / 10 = 500 butterflies.
The method rests on several assumptions: marks do not fall off or affect survival, marked and unmarked animals mix randomly between sampling sessions, the population is "closed" (no births, deaths, immigration, or emigration between sessions), and all individuals have an equal probability of capture. In practice, these assumptions are often violated, and ecologists use more sophisticated models (like the Jolly-Seber method for open populations) that relax these assumptions using multiple recapture sessions and maximum likelihood estimation.
Key idea: Mark-recapture estimates population size using the ratio of marked to unmarked animals in a second sample: N = (M x C) / R.
Counting butterflies requires first identifying them to species — a skill that combines visual pattern recognition, knowledge of anatomy, and understanding of biogeography. India has approximately 1,500 butterfly species, of which about 700 are found in Northeast India alone. Identification relies on a hierarchy of features: wing shape and size, color pattern, the arrangement of veins in the wing, the structure of the antennae, the shape of the genital claspers (for closely related species), and geographic range.
Butterfly classification uses the same binomial nomenclature system developed by Carl Linnaeus in 1753. Each species has a two-part Latin name: the genus name (capitalized) and the species epithet (lowercase), both italicized. For example, Papilio memnon (the Great Mormon butterfly) belongs to the genus Papilio (swallowtails). Related genera are grouped into families (Papilionidae = swallowtails), families into orders (Lepidoptera = butterflies and moths), and so on up to kingdoms and domains. This hierarchical system reflects evolutionary relationships — species in the same genus share a more recent common ancestor than species in different genera.
Modern taxonomy increasingly uses DNA barcoding — sequencing a standard gene region (typically a 658-base-pair segment of the mitochondrial cytochrome oxidase I gene, or COI) and comparing it to a reference database. Species typically differ by at least 2-3% in this gene, allowing identification even from a fragment of wing or a single leg. DNA barcoding has revealed that many "species" previously identified by appearance alone are actually complexes of multiple cryptic species — visually identical but genetically distinct. In Northeast India, DNA barcoding has increased the known butterfly species count by an estimated 10-15%.
Key idea: Species identification combines visual pattern recognition with DNA barcoding — which has revealed that many apparent single species are actually multiple cryptic species.
Access all 130+ lessons, quizzes, interactive tools, and offline activities
Citizen science — scientific research conducted with participation from non-professional volunteers — has become one of the most powerful tools in eco...